概念
dagre 是专注于有向图布局的 javascript 库,由于 **==dagre 仅仅专注于图形布局 #F44336==**,需要使用其他方案根据 dagre 的布局信息来实际渲染图形,而 dagre-d3 就是 dagre 基于 D3 的渲染方案。
dagre: https://github.com/dagrejs/dagre
dagre-d3: https://github.com/dagrejs/dagre-d3
步骤
- 引入 d3.js 以及 dagre-d3.js 两个文件。
- 使用 dagre-d3 创建 Graph 对象,并添加节点和边。
- 创建渲染器并在 svg 上绘制流程图。
1
2
3
4
5
6
7
8
9
10
11
12
13
14
15
16
17
18
19
20
21
22
23
24
25
26
27
28
29
30
31
32
33
34
35
36
37
38
39
40
41
42
43
44
45
46
47
48
49
50
51
52
53
54
55
56
57
58
59
60
61
62
63
64
65
| <!DOCTYPE html>
<html lang="en">
<head>
<meta charset="UTF-8">
<meta http-equiv="X-UA-Compatible" content="IE=edge">
<meta name="viewport" content="width=device-width, initial-scale=1.0">
<title>Document</title>
<script src="node_modules/d3/dist/d3.min.js"></script>
<script src="node_modules/dagre-d3/dist/dagre-d3.min.js"></script>
</head>
<body>
<div>
<svg style="width:800px;height:800px"></svg>
</div>
</body>
</html>
<script>
let dataset = {
nodes: [
{ id: 0, label: "流动人员", shape: "rect" },
{ id: 1, label: "安全筛查", shape: "rect" },
{ id: 2, label: "热像仪人体测温筛查", shape: "diamond" },
{ id: 3, label: "人工复测", shape: "diamond" },
{ id: 4, label: "快速通过", shape: "rect" },
{ id: 5, label: "紧急处理", shape: "rect" }
],
edges: [
{ source: 0, target: 1, label: "" },
{ source: 1, target: 2, label: "" },
{ source: 2, target: 4, label: "正常" },
{ source: 2, target: 3, label: "不正常" },
{ source: 3, target: 5, label: "不正常" },
{ source: 3, target: 4, label: "正常" }
]
}
let g = new dagreD3.graphlib.Graph();
g.setGraph({
rankdir: 'LR'
});
dataset.nodes.forEach(item => {
g.setNode(item.id, {
label: item.label,
shape: item.shape,
style: "fill:#fff;stroke:#000"
})
})
dataset.edges.forEach(item => {
g.setEdge(item.source, item.target, {
label: item.label,
style: "fill:#fff;stroke:#333;stroke-width:1.5px"
})
})
let render = new dagreD3.render();
let svgGroup = d3.select('svg').append('g');
render(svgGroup, g);
</script>
|
知识点
- gragh, 图整体,配置全局参数
- node, 顶点,dagre 在计算时并不关心 node 实际的形状、样式,只要求提供维度信息
- edge, 边,edge 需要声明其两端的 node 以及本身方向。例如A -> B表示一条由 A 指向 B 的 edge
- rank, 层级,rank 是流程图布局中的核心逻辑单位,edge 两端的 node 一定属于不同的rank,而同一 rank 中的 node 则会拥有同样的深度坐标(例如在纵向布局的 graph 中 y 坐标相同)
- label, 标签,label 不是必要元素,但 dagre 为了适用更多的场景增加了对 edge label 的布局计算
配置项
gragh 配置
设置 node 节点的延伸排列方向,它有4个值: TB, BT, LR, 或者 RL 可选,默认是’TB’(从上到下)。这里T = top, B = bottom, L = left, and R = right
设置相同 rank 中 node 节点的对齐方式,它也有4个值可选,UL(上左), UR(上右), DL(下左), 或者 DR(下右),默认是 undefined 。这里U = up, D = down, L = left, and R = right
nodesep 即 相同层级 rank 中 node 的间距。默认 50
edgesep 即 edge 之间的间距。默认 10
ranksep 即相邻层级之间的间距,例如 示例 1 中 A 和 B 的间距以及 B 和 C 的间距。默认 50
marginx 即 图整体与画布的左右间距。默认 0
marginy 即 图整体与画布的上下间距。默认 0
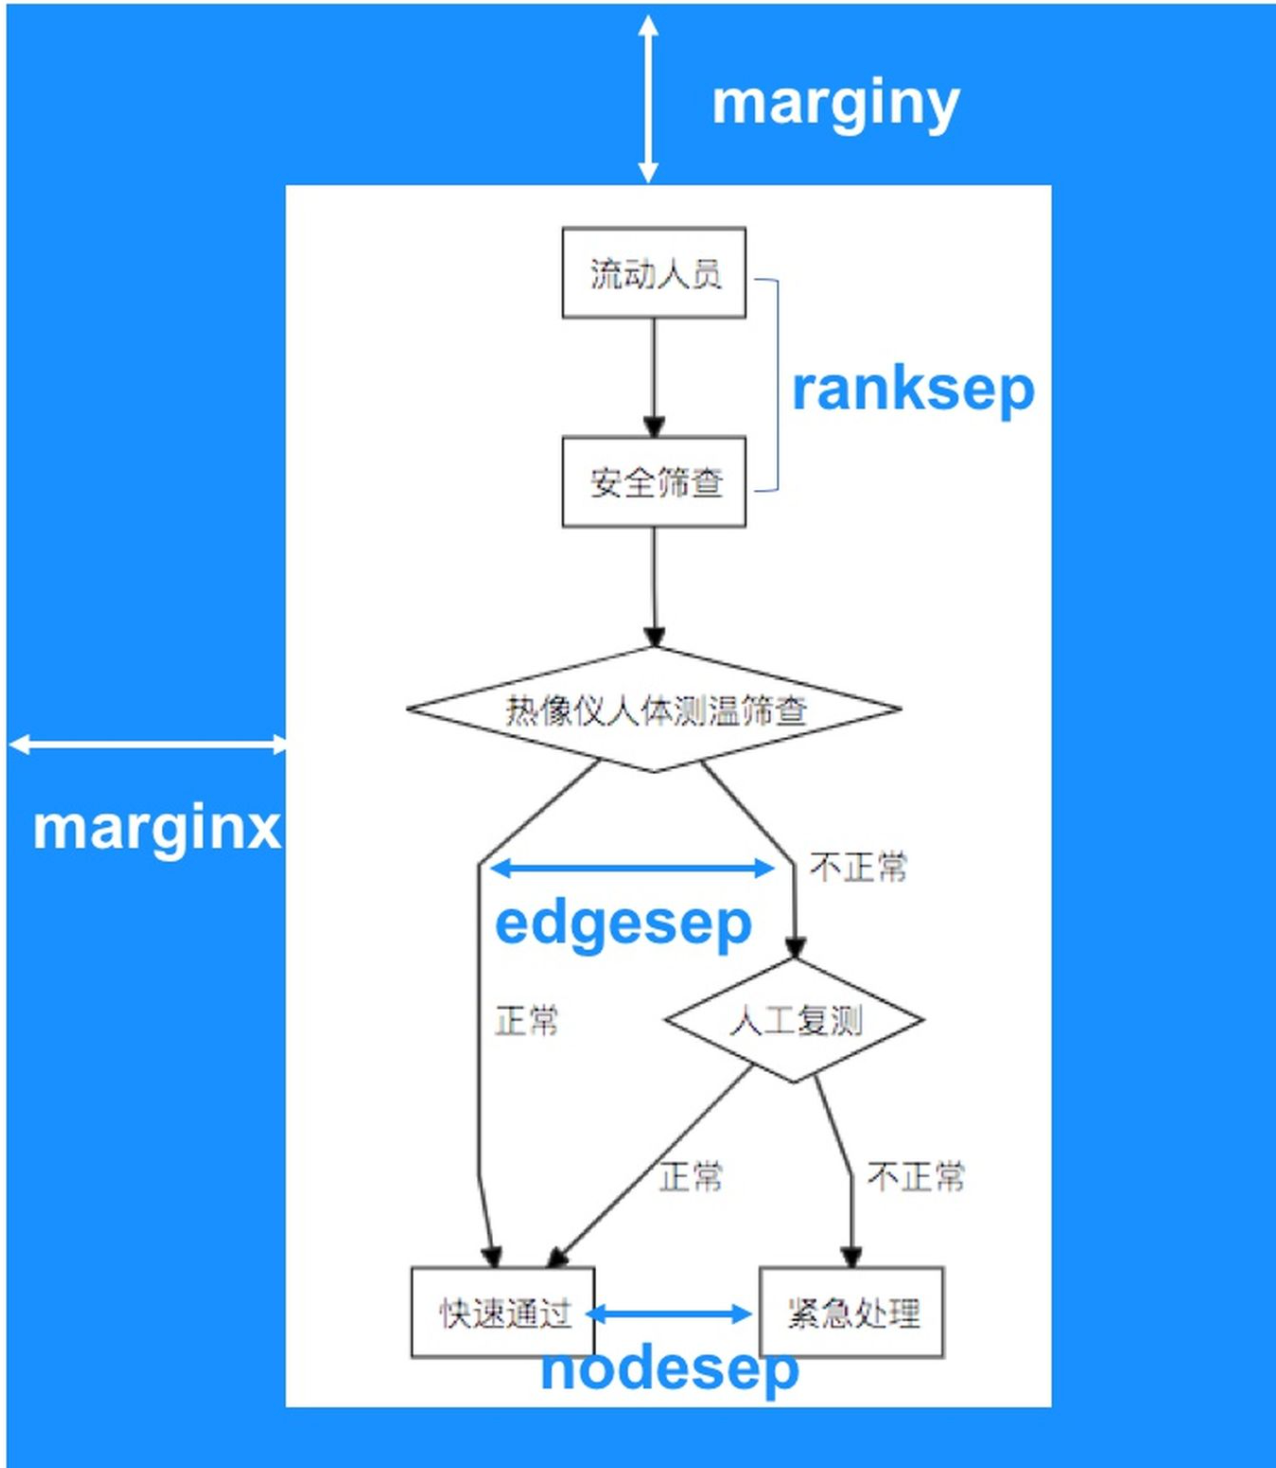
注意:相邻两个节点不跨层级时,nodesep 和ranksep 实际是一样的
1
2
3
4
5
6
7
8
9
| g.setGraph({
rankdir:'LR',
align:'DL',
nodesep: 100,
edgesep:100,
ranksep: 50,
marginx:50,
marginy:100
});
|
node 配置
- labelType节点标签格式,可以设置文本以及html格式
- label 节点标签,即节点上要显示的文本,设置html格式时,label为html标签
- shape 节点形状,可以设置rect,circle,ellipse,diamond 四种形状,还可以使用render.shapes()自定义形状
- style 节点样式, 可设置节点的颜色填充、节点边框,如style: “fill:#fff;stroke:#faf”
- labelStyle 节点标签样式, 可设置节点标签的文本样式(颜色、粗细、大小),如style: “fill:#afa;font-weight:bold”
- width 即节点宽度
- height 即节点高度
edge 配置
- abelType边标签格式,可以设置文本以及 html 格式,默认为文本格式。
- label 边标签,即节点上要显示的文本,设置 html 格式时,label为 html 标签。
- style 边样式, 可设置边的颜色填充、边框,如style: “fill:#fff;stroke:#faf”
- labelStyle 边标签样式, 可设置边标签的文本样式(颜色、粗细、大小),如labelStyle: “fill:#afa;font-weight:bold”
- arrowhead 箭头形状,可以设置 normal,vee,undirected 三种样式,默认为 normal。
- arrowheadStyle 箭头样式,可以设置箭头颜色等,如 arrowheadStyle:”fill:#f66”
交互
以下是d3在v5版本上的代码 ,最新v6需要修改。
拖拽缩放
1
2
3
4
5
6
7
| let svg = d3.select('svg')
let zoom = d3.zoom()
.on("zoom", function () {
svgGroup.attr("transform", d3.event.transform);
});
svg.call(zoom);
|
鼠标悬停 tootip
1
2
3
4
5
6
7
8
9
10
11
12
13
14
15
16
17
18
19
20
21
22
23
24
25
26
27
28
29
30
31
32
33
34
35
|
function createTooltip() {
return d3.select('body')
.append('div')
.classed('tooltip', true)
.style('opacity', 0)
.style('display', 'none');
};
let tooltip = createTooltip();
function tipVisible(textContent) {
tooltip.transition()
.duration(400)
.style('opacity', 0.9)
.style('display', 'block');
tooltip.html(textContent)
.style('left', (d3.event.pageX + 15) + 'px')
.style('top', (d3.event.pageY + 15) + 'px');
}
function tipHidden() {
tooltip.transition()
.duration(400)
.style('opacity', 0)
.style('display', 'none');
}
svgGroup.selectAll("g.node")
.on("mouseover", function (v) {
tipVisible(g.node(v).label);
})
.on("mouseout", function (v) {
tipHidden();
})
|
1
2
3
4
5
6
7
8
9
10
11
12
13
14
15
16
17
| <style>
.tooltip {
position: absolute;
font-size: 12px;
text-align: center;
background-color: white;
border-radius: 3px;
box-shadow: rgb(174, 174, 174) 0px 0px 10px;
cursor: pointer;
display: inline-block;
padding: 10px;
}
.tooltip>div {
padding: 10px;
}
</style>
|
参考
 wechat
 alipay